Short answers numerical questions long answers : Solutions of Questions on Page Number : 198
Q1 :List the techniques of Financial Statement Analysis.
Answer : The following are the commonly used techniques of Financial Statement analysis :
1. Comparative Financial Statements
2. Common Size Financial Statements
3. Trend Analysis
4. Ratio Analysis
5. Cash Flow Statement
6. Fund Flow Statement
The above listed techniques can be classified on the following basis:
A. On the basis of Comparison
1. Inter-firm Comparison
a) Comparative Statement (Balance Sheet, Profit and Loss Account)
b) Common size Statement (of the same period)
c) Ratio of two or more Competitive Firms (of the same period)
d) Cash Flow Statement of two or more Competitive firms
e) Polygon, Bar Diagram
2. Intra-firm Comparison
a) Comparative Statement (Balance Sheet, Profit and Loss Account)
b) Common size Statement (of the same period)
c) Ratio of two or more Competitive Firms (of the same period)
d) Cash Flow Statement of two or more Competitive firms
e) Polygon, Bar Diagram
3. Horizontal Comparison
4. Vertical Comparison
B. On the basis of Time
1. Inter-period Comparison
a) Comparative statement (two or more periods)
b) Cash Flow statement (two or more period) etc.
2. Cross Sectional (Intra-period) Comparison
a) Common size statement
b) Ratio Analysis
C. Horizontal Analysis
1. Time series
2. Bar Diagram
3. Polygon
4. Comparative statement
5. Ratio Analysis
D. Vertical Analysis
1. Common size statement
2. Pie Diagram
Q2 :Describe the different techniques of financial analysis and explain the limitations of financial analysis.
Answer : The various techniques used in financial analysis are as follows:
1. Comparative Statements: These statements depict the figures of two or more accounting years simultaneously that help to access the profitability and financial position of a business. The Comparative Statements help us in analysing the trend of the financial position of the business. These statements also enable us to undertake various types of comparisons like inter-firm comparisons and intra-firm comparisons. It presents the change in the financial items both in absolute as well as percentage terms. Therefore, these statements help in measuring the efficiency of the business in relative terms. The analyses based on these statements are known as Horizontal Analysis.
2. Common Size Statements: These statements depict the relationship between various items of financial statements and some common items (like Net Sales and the Total of Balance Sheet) in percentage terms. In other words, various items of Trading and Profit and Loss Account such as Cost of Goods Sold, Non-Operating Incomes and Expenses are expressed in terms of percentage of Net Sales. On the other hand, different items of Balance Sheet such as Fixed Assets, Current Assets, Share Capital, etc. are expressed in terms of percentage of Total of Balance Sheet. These percentage figures are easily comparable with that of the previous years’ (i.e. inter-firm comparison) and with that of the figures of other firms in the same industry (i.e. inter-firm comparison) as well. The analyses based on these statements are commonly known as Vertical Analysis.
3. Trend Analysis: This analysis undertakes the study of trend in the financial positions and the operating performance of a business over a series of successive years. In this technique, a particular year is assumed to be the base year and the figures of all other years are expressed in percentage terms of the base year’s figures. These trends (or the percentage figures) not only helps in assessing the operational efficiency and the financial position of the business but also helps in detecting the problems and inefficiencies.
4. Ratio Analysis: This technique depicts the relationship between various items of Balance Sheet and the Income Statements. It helps in ascertaining the profitability, operational efficiency, solvency, etc of a firm. The analysis expresses financial items in terms of percentage, fraction, proportion and as number of times. It enables budgetary controls by assessing the qualitative relationship among different financial variables. This analysis provides vital information to different accounting users regarding the financial position, viability and performance of a firm. It also facilitates decision making and policy designing process.
5. Cash Flow Analysis: This analysis is presented in the form of a statement showing inflows and outflows of cash and cash equivalents from operating, investing and financing activities of a company during a particular period of time. It helps in analysing the reasons of receipts and payments in cash and change in the cash balances during an accounting year in a company.
Limitations of Financial Analysis
The limitations of Financial Analysis are :
1. Ignores Changes in the Price level
The financial analysis fails to capture the change in price level. The figures of different years are taken on nominal values and not in real terms (i.e. not taking price change into considerations).
2. Misleading and Wrong Information
The financial analysis fails to reveal the change in the accounting procedures and practices. Consequently they may provide wrong and misleading information.
3. Interim and Final Picture
The financial analysis presents only the interim report and thereby provides incomplete information. They fail to provide the final and holistic picture.
4. Ignores Qualitative and Non-monetary Aspects
The financial analysis reveals only the monetary aspects. In other words, these analyses consider only that information that can be expressed only in monetary terms. These analyses fail to disclose managerial efficiency, growth prospects, and other non-operational efficiency of a business.
5. Accounting Concepts and Conventions
The financial analysis are based an accounting concepts and conventions. Therefore, the analysis and conclusions based on such analyses may not be reliable. For example, the analysis considers only the book-value of various items (i.e. according to the Going Concept) and consequently ignores the present market value of those items. Hence, the analysis may not be realistic.
6. Involves Personal Biasness
The financial analysis reflects the personal biasness and personal value judgments of the accountants and clerks involved. There are different techniques used by different personnel for charging depreciation (original cost or written-down value method) and also for inventory valuation. The use of different techniques by different people reduces the effectiveness of the financial analysis.
7. Unsuitable for Comparisons
Due to the involvement of personal value judgment, personal biasness and use of different techniques by different accountant, various types of comparisons such as inter-firm and intra-firm comparisons may not be possible and reliable.
Q3:Distinguish between Vertical and Horizontal Analysis of financial data.
Answer :
|
Basis of Difference |
Horizontal Analysis |
Vertical Analysis |
|
Meaning |
It refers to the comparison of an item of the financial |
It refers to the comparison of itemitems of the |
|
Purpose |
Its purpose is to determine the change in an item |
Its purpose is to determine the proportion of |
|
Usefulness |
It indicates growth or decline of the item. |
It helps in predicting and determining the future |
Q4 Explain the usefulness of trend percentages in interpretation of financial performance of a company.
Answer : The Trend Analysis presents each financial item in percentage terms for each year. These Trend Analyses not only help the accounting users to assess the financial performance of the business but also assist them to form an opinion about various tendencies and predict the future trend of the business.
Usefulness and Importance of Trend Analysis
The following are the various importance of Trend Analysis:
1. Assists in forecasting
The trends provided by Trend Analysis help the accounting users to forecast the future trend of the business.
2. Percentage Terms
The trends are expressed in percentage terms. Analysing the percentage figures is easy and also less time consuming.
3. User Friendly
As the trends are expressed in percentage figures, so it is the most popular financial analysis to analyse the financial performance and operational efficiency of the company. In other words, one need not to have an in-depth and sophisticated knowledge of accounting in order to analyse these percentage trends.
4. Presents a Broader Picture
The trend analysis presents a broader picture about the financial performance, viability and operational efficiency of a business. Generally, companies prefer to present their financial data for a period of 5 or 10 years in forms of percentage trends, whereas the other techniques of Financial Analysis lack this popularity.
Q5 : Explain the meaning of Analysis and Interpretation.
Answer : Analysis and Interpretation refers to a systematic and critical examination of the financial statements. It not only establishes cause and effect relationship among the various items of the financial statements but also presents the financial data in a proper manner. The main purpose of Analysis and Interpretation is to present the financial data in such a manner that is easily understandable and self explanatory. This not only helps the accounting users to assess the financial performance of the business over a period of time but also enables them in decision making and policy and financial designing process.
|
Country Man Ltd Comparative statement as on March 31, 2010 and 2011
|
||||
|
Particular |
2009–10 |
2010–11 |
Absolute Change |
% Change |
|
Sales |
1,00,000 |
1,50,000 |
50,000 |
50 |
|
Less: Cost of Goods Sold |
60,000 |
78,000 |
18,000 |
30 |
|
Gross Profit |
40,000 |
72,000 |
32,000 |
80 |
|
Less: Operating Expenses: |
||||
|
Office and Administrative Exp. |
8,000 |
10,000 |
2,000 |
25 |
|
Selling and Distribution Exp. |
5,000 |
6,000 |
1,000 |
20 |
|
Operating Profit |
27,000 |
56,000 |
29,000 |
107.4 |
|
Add: Other Income |
3,000 |
4,800 |
1,800 |
60 |
|
Less: Non-operating Expenses |
4,000 |
4,800 |
800 |
20 |
|
Profit Before Interest and Tax |
26,000 |
56,000 |
30,000 |
115.38 |
|
Interest |
2,000 |
1,800 |
(200) |
(10) |
|
Profit before Tax |
24,000 |
54,200 |
30,200 |
125.83 |
|
Less: 50% Income Tax |
12,000 |
27,100 |
15,100 |
125.83 |
|
|
12,000 |
27,100 |
15,100 |
125.83 |
![]()
Interpretation:
1. Sales of the company have increased by 50% during the year 2010 – 11 whereas the cost of goods sold has also increased but at a lesser rate. From this, we can infer that the company has followed an efficient sales strategy consequent of which the gross profit of the company has increased by 80% compared to the previous year (2009-10).
2. In 2010 – 11, operating expenses have also increased but on the contrary operating profit has increased at a higher rate than the rate of operating expenses.
3. Profit before interest and tax has also increased by 115.38% during these two years. This indicates the improvement in the operating efficiency of the company.
Q6 :What is the importance of comparative statements? Illustrate your answer with particular reference to comparative income statement.
Answer :
The following are the importance of Comparative Statements.
1. Simple Presentation
The Comparative Statements present the financial data in a simpler form. Moreover, the year-wise data of the same items are presented side-by-side, which not only makes the presentation clear but also enables easy comparisons (both intra-firm and inter-firm) conclusive.
2. Easy for Drawing Conclusion
The presentation of comparative statement is so effective that it enables the analyst to draw conclusion quickly and easily and that too without any ambiguity
3. Easy to Forecast
The comparative analysis of profitability and operational efficiency of a business over a period of time helps in analysing the trend and also assists the management to forecast and draft various future plans and policy measures accordingly.
4. Easy Detection of Problems
By comparing the financial data of two or more years, the financial management can easily detect the problems. While comparing the data, some items may have increased while others have decreased or remained constant. The comparative analysis not only enables the management in locating the problems but also helps them to put various budgetary controls and corrective measures to check whether the current performance is aligned with that of the planned targets.
Q7:State the importance of Financial Analysis?
Answer: Financial Analysis has great importance to various accounting users on various matters. Income Statements, Balance Sheets and other financial data provides information about expenses and sources of income, profit or loss and also helps in assessing the financial position of a business. These financial data are not useful until they are analysed. There are various tools and methods such as Ratio Analysis, Cash Flow Statements that make the financial data to cater varying needs of various accounting users.
The following are the reasons that advocate in favour of Financial Analysis:
1. It helps in evaluating the profit earning capacity and financial feasibility of a business.
2. It helps in assessing the long-term solvency of the business.
3. It helps in evaluating the relative financial status of a firm in comparison to other competitive firms.
4. It assists management in decision making process, drafting various plans and also in establishing an effective controlling system.
Q8 :What do you understand by analysis and interpretation of financial statements? Discuss their importance.
Answer : Financial Analysis has great importance to various accounting users on various matters. Income Statements, Balance Sheets and other financial data provide information about expenses and sources of income, profit or loss and also helps in assessing the financial position of a business. These financial data are not useful until they are analysed. There are various tools and methods such as Ratio Analysis, Cash Flow Statements that make the financial data to cater varying needs of various accounting users.
The following are the reasons that advocate in favour of Financial Analysis:
1. It helps in evaluating the profit earning capacity and financial feasibility of a business.
2. It helps in assessing the long-term solvency of the business.
3. It helps in evaluating the relative financial status of a firm in comparison to other competitive firms.
4. It assists management in decision making process, drafting various plans and also in establishing an effective controlling system.
Q9 :What are Comparative Financial Statements?
Answer : Those financial statements that enable intra-firm and inter-firm comparisons of financial statements over a period of time are called Comparative Financial Statements. In other words, these statements help the accounting users to evaluate and assess the financial progress in the relative terms. These statements express the absolute figures, absolute change and the percentage change in the financial items over a period of time. Comparative Financial Statements present the financial data in such a manner that is easily understandable and can be analysed without any ambiguity. If the accounting policies and practices for the treatment of the items are same over the period of study, only then the Comparative Financial Statements enable meaningful comparisons.
The following are the two Comparative Financial Statements that are commonly prepared:
1. Comparative Balance Sheet
2. Comparative Income Statements
Q10 :Explain how common size statements are prepared giving an example.
Answer :
The two Common Size Statements that are most commonly prepared are as follows.
1. Common Size Balance Sheet
2. Common Size Income Statements
Common Size Statement is prepared in a columnar form for analysis. In a Common Size Statement each item of the financial statements is compared to a common item. The analyses based on these statements are commonly known as Vertical Analysis.
The following are the columns prepared in a Common Size Statement.
1. Particulars Column: This column shows the various financial items under their respective heads.
2. Amount Columns: These columns depict the amount of each item, sub-totals and the gross total of a particular year.
3. Percentage or Ratio Columns: These columns show the proportion of each item to the common item either in terms of percentage or ratio.
The Common Size Statements can be presented in the following two ways.
Method 1
1. Percentage Column is shown beside the Amount Column of the year to which percentage column belongs.
|
Particulars |
Year (2007) Rs |
% |
Year (2006) Rs |
% |
Method 2
Amount Columns are shown first and their percentage columns are shown after the Amount Columns.
|
Particulars |
Year (2007) Rs |
Year (2008) Rs |
% 2007 |
% 2008 |
The preparation of the Common Size Statements can be better understood by the help of the following example.
|
Particulars |
Note No. |
2012 |
2013 |
|
I. Equity and Liabilities |
|||
|
1. Shareholders’ Funds |
|||
|
(a) Equity Share Capital |
4,00,000 |
6,00,000 |
|
|
(b) Reserves and Surplus |
1,00,000 |
1,50,000 |
|
|
2. Non-Current Liabilities |
|||
|
(a) Long-Term Borrowings |
3,00,000 |
3,20,000 |
|
|
3. Current Liabilities |
|||
|
(a) Trade Payables |
2,00,000 |
2,50,000 |
|
|
Total |
10,00,000 |
13,20,000 |
|
|
II. Assets |
|||
|
1. Non-Current Assets |
|||
|
(a) Fixed Assets |
|||
|
(i) Tangible Assets |
5,00,000 |
6,75,000 |
|
|
(ii) Intangible Assets |
1,00,000 |
1,20,000 |
|
|
(b) Non-Current Investments |
1,50,000 |
2,00,000 |
|
|
2. Current Assets |
2,50,000 |
3,25,000 |
|
|
Total |
10,00,000 |
13,20,000 |
|
|
Common Size Balance Sheet as on…. |
|||||
|
Particulars |
Note No. |
Absolute Amount |
Percentage of Balance Sheet Total |
||
|
2012 (Rs) |
2013 (Rs) |
2012 (%) |
2013 (%) |
||
|
I. Equity and Liabilities |
|||||
|
1. Shareholders’ Funds |
|||||
|
(a) Equity Share Capital |
4,00,000 |
6,00,000 |
40 |
45.45 |
|
|
(b) Reserves and Surplus |
1,00,000 |
1,50,000 |
10 |
11.36 |
|
|
2. Non-Current Liabilities |
|||||
|
(a) Long-Term Borrowings |
3,00,000 |
3,20,000 |
30 |
24.24 |
|
|
3. Current Liabilities |
|||||
|
(a) Trade Payables |
2,00,000 |
2,50,000 |
20 |
18.94 |
|
|
Total |
10,00,000 |
13,20,000 |
100 |
100 |
|
|
II. Assets |
|||||
|
1. Non-Current Assets |
|||||
|
(a) Fixed Assets |
|||||
|
(i) Tangible Assets |
5,00,000 |
6,75,000 |
50 |
51.14 |
|
|
(ii) Intangible Assets |
1,00,000 |
1,20,000 |
10 |
9.09 |
|
|
(b) Non-Current Investments |
1,50,000 |
2,00,000 |
15 |
15.15 |
|
|
2. Current Assets |
2,50,000 |
3,25,000 |
25 |
24.62 |
|
|
Total |
10,00,000 |
13,20,000 |
100 |
100 |
|
Working Note
For Example
Preparation
Step 1: Title of the Common Size Statement, i.e. ‘Common Size Balance Sheet’ is written on the top of the statement.
Step 2: In the ‘Particulars’ column, the various items of the Balance Sheet are shown under the headings of ‘Assets’ and ‘Equity and Liabilities’.
Step 3: In the ‘Amount’ column, amount of the items are shown in the ‘Year’ column to which they belong.
strong>Step 4: The Assets and Liabilities are totaled and are shown separately for each year.
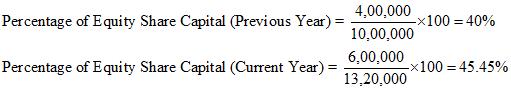
Step 5: In the ‘Percentage’ column, the percentage of each item in comparison to the Total of Balance Sheet are shown.
Q11 :What do you mean by Common Size Statements?
Answer : These statements depict the relationship between various items of financial statements and some common items (like Net Sales and the Total of Balance Sheet) in percentage terms. In other words, various items of Trading and Profit and Loss Account such asCost of Goods Sold, Non-Operating Incomes and Expenses are expressed in terms of percentage of Net Sales. On the other hand, different items of Balance Sheet such as Fixed Assets, Current Assets, Share Capital etc. are expressed in terms of percentage of Total of Balance Sheet. These percentage figures are easily comparable with that of the previous years’ (i.e. inter-firm comparison) and with that of the figures of other firms in the same industry (i.e. inter-firm comparison) as well.
The analyses based on these statements are commonly known as Vertical Analysis.
The following are commonly prepared Common Size Statements.
1. Common Size Balance Sheet
2. Common Size Income Statements
Q12: Following are the balance sheets of Alpha Ltd. as at March 31st, 2013 and 2014:
| Particulars | 2013 Rs. |
2014 Rs. |
| I. Equity and Liabilities | ||
|
Equity share capital
|
2,00,000 | 4,00,000 |
|
Reserves and surplus
|
1,00,000 | 1,50,000 |
|
Long-term borrowings
|
2,00,000 | 3,00,000 |
|
Short-term borrowings
|
50,000 | 70,000 |
|
Trade payables
|
30,000 | 60,000 |
|
Short-term provisions
|
20,000 | 10,000 |
|
Other current liabilities
|
20,000 | 30,000 |
| Total | 6,20,000 | 10,20,000 |
| II. Assets | ||
|
Fixed assets
|
2,00,000 | 5,00,000 |
|
Non-current investments
|
1,00,000 | 1,25,000 |
|
Current investments
|
60,000 | 80,000 |
|
Inventories
|
1,35,000 | 1,55,000 |
|
Trade receivables
|
60,000 | 90,000 |
|
Short term loans and advances
|
40,000 | 60,000 |
|
Cash at bank
|
25,000 | 10,000 |
| Total | 6,20,000 | 10,20,000 |
Answer:
|
Comparative Balance Sheet as on March 31, 2013 and 2014 |
||||
|
Particulars |
2013 (Rs) |
2014 (Rs) |
Absolute Change |
Percentage Change |
|
I. Equity and Liabilities |
||||
|
1. Shareholder’s Fund |
||||
|
a. Equity Share Capital |
2,00,000 |
4,00,000 |
2,00,000 |
100 |
|
b. Reserves and Surplus |
1,00,000 |
1,50,000 |
50,000 |
50 |
|
2. Non-Current Liabilities |
||||
|
a. Long Term Borrowings |
2,00,000 |
3,00,000 |
1,00,000 |
50 |
|
3. Current Liabilities |
||||
|
a. Short Term Borrowings |
50,000 |
70,000 |
20,000 |
40 |
|
b. Trade Payables |
30,000 |
60,000 |
30,000 |
100 |
|
c. Short Term Provisions |
20,000 |
10,000 |
(10,000) |
(50) |
|
d. Other Current Liabilities |
20,000 |
30,000 |
10,000 |
50 |
|
Total |
6,20,000 |
10,20,000 |
4,00,000 |
64.5 |
|
II. Assets |
||||
|
1. Non-Current Assets |
||||
|
a. Fixed Assets |
2,00,000 |
5,00,000 |
3,00,000 |
150 |
|
b. Non Current Investments |
1,00,000 |
1,25,000 |
25,000 |
25 |
|
2. Current Assets |
||||
|
a. Current Investments |
60,000 |
80,000 |
20,000 |
33.3 |
|
b. Inventories |
1,35,000 |
1,55,000 |
20,000 |
14.8 |
|
c. Trade Receivables |
60,000 |
90,000 |
30,000 |
50 |
|
d. Short Term Loans and Advances |
40,000 |
60,000 |
20,000 |
50 |
|
e. Cash and Cash Equivalents |
25,000 |
10,000 |
(15,000) |
(60) |
|
Total |
6,20,000 |
10,20,000 |
4,00,000 |
64.5 |
Q13: Following are the balance sheets of Beta Ltd. at March 31st, 2013 and 2014:
| Particulars | 2014 Rs. |
2013 Rs. |
| I. Equity and Liabilities | ||
|
Equity share capital
|
4,00,000 | 3,00,000 |
|
Reserves and surplus
|
1,50,000 | 1,00,000 |
|
Loan from IDBI
|
3,00,000 | 1,00,000 |
|
Short-term borrowings
|
70,000 | 50,000 |
|
Trade payables
|
60,000 | 30,000 |
|
Short-term provisions
|
10,000 | 20,000 |
|
Other current liabilities
|
1,10,000 | 1,00,000 |
| Total | 11,00,000 | 7,00,000 |
| II. Assets | ||
|
Fixed assets
|
4,00,000 | 2,20,000 |
|
Non-current investments
|
2,25,000 | 1,00,000 |
|
Current investments
|
80,000 | 60,000 |
|
Stock
|
1,05,000 | 90,000 |
|
Trade receivables
|
90,000 | 60,000 |
|
Short term loans and advances
|
1,00,000 | 85,000 |
|
Cash and cash equivalents
|
1,00,000 | 85,000 |
| Total | 11,00,000 | 7,00,000 |
Answer:
|
Comparative Balance Sheet as on March 31, 2013 and 2014 |
||||
|
Particulars |
2013 (Rs) |
2014 (Rs) |
Absolute Change |
Percentage Change |
|
I. Equity and Liabilities |
||||
|
1. Shareholder’s Fund |
||||
|
a. Equity Share Capital |
3,00,000 |
4,00,000 |
1,00,000 |
33.3 |
|
b. Reserves and Surplus |
1,00,000 |
1,50,000 |
50,000 |
50 |
|
2. Non-Current Liabilities |
||||
|
a. Long Term Borrowings |
1,00,000 |
3,00,000 |
2,00,000 |
200 |
|
3. Current Liabilities |
||||
|
a. Short Term Borrowings |
50,000 |
70,000 |
20,000 |
40 |
|
b. Trade Payables |
30,000 |
60,000 |
30,000 |
100 |
|
c. Short Term Provisions |
20,000 |
10,000 |
(10,000) |
(50) |
|
d. Other Current Liabilities |
1,00,000 |
1,10,000 |
10,000 |
10 |
|
Total |
7,00,000 |
11,00,000 |
4,00,000 |
57.14 |
|
II. Assets |
||||
|
1. Non-Current Assets |
||||
|
a. Fixed Assets |
2,20,000 |
4,00,000 |
1,80,000 |
81.8 |
|
b. Non Current Investments |
1,00,000 |
2,25,000 |
1,25,000 |
125 |
|
2. Current Assets |
||||
|
a. Current Investments |
60,000 |
80,000 |
20,000 |
33.3 |
|
b. Inventories (Stock) |
90,000 |
1,05,000 |
15,000 |
16.6 |
|
c. Trade Receivables |
60,000 |
90,000 |
30,000 |
50 |
|
d. Short Term Loans and Advances |
85,000 |
1,00,000 |
15,000 |
17.65 |
|
e. Cash and Cash Equivalents |
85,000 |
1,00,000 |
15,000 |
17.65 |
|
Total |
7,00,000 |
11,00,000 |
4,00,000 |
57.14 |
Q14: Prepare Comparative Income Statement from the following information:
| Particulars | 2014 Rs. |
2013 Rs. |
| Freight Outward | 20,000 | 10,000 |
| Wages (office) | 10,000 | 5,000 |
| Manufacturing Expenses | 50,000 | 20,000 |
| Stock adjustment | (60,000) | 30,000 |
| Cash purchases | 80,000 | 60,000 |
| Credit purchases | 60,000 | 20,000 |
| Returns inward | 8,000 | 4,000 |
| Gross profit | (30,000) | 90,000 |
| Carriage outward | 20,000 | 10,000 |
| Machinery | 3,00,000 | 2,00,000 |
| Charge 10% depreciation on machinery | 10,000 | 5,000 |
| Interest on short-term loans | 20,000 | 20,000 |
| 10% debentures | 20,000 | 10,000 |
| Profit on sale of furniture | 20,000 | 10,000 |
| Loss on sale of office car | 90,000 | 60,000 |
| Tax rate | 40% | 50% |
Answer:
|
Comparative Income Statement for the year ended March 31, 2013 and 2014 |
|||||
|
Particulars |
Note No. |
2013 (Rs) |
2014 (Rs) |
Absolute Change |
Percentage Change |
|
1. Revenue from Operations |
2,16,000 |
92,000 |
(1,24,000) |
(57.4) |
|
|
2. Other Income |
10,000 |
20,000 |
10,000 |
100 |
|
|
3. Total Revenue (1 + 2) |
2,26,000 |
1,12,000 |
(1,14,000) |
(50.44) |
|
|
4. Expenses |
|||||
|
a. Purchases of Stock-in-Trade |
80,000 |
1,40,000 |
60,000 |
75 |
|
|
b. Change in Inventories |
30,000 |
(60,000) |
(90,000) |
(300) |
|
|
c. Employee Benefit Expenses |
5,000 |
10,000 |
5,000 |
100 |
|
|
d. Finance Costs |
21,000 |
22,000 |
1,000 |
4.54 |
|
|
e. Depreciation and Amortisation Expenses |
5,000 |
10,000 |
5,000 |
100 |
|
|
f. Other Expenses |
80,000 |
1,30,000 |
50,000 |
62.5 |
|
|
Total Expenses |
2,21,000 |
2,52,000 |
31,000 |
14.03 |
|
|
5. Profit before Tax (3 – 4) |
5,000 |
(1,40,000) |
(83,000) |
16.6 |
|
|
Less: Income Tax |
2,500 |
– |
(2,500) |
(100) |
|
|
6. Profit After Tax |
2,500 |
(1,40,000) |
(1,37,500) |
55 |
|
Working Notes
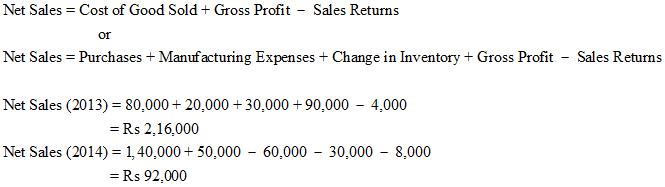
1.Calculation of Net Sales
2. Calculation of Finance Cost
Finance Cost = Interest on short-term loans + Interest on 10% Debentures
Finance Cost (2013) = 20,000 + 1,000 = Rs 21,000
Finance Cost (2014) = 20,000 + 2,000 = Rs 22,000
3.Calculation of Other Expenses
Other Expenses = Freight Outward + Carriage Outward + Loss on sale of office car
Other Expenses (2013) = 10,000 + 10,000 + 60,000 = Rs 80,000
Other Expenses (2014) = 20,000 + 20,000 + 90,000 = Rs 1,30,000
Q15: Prepare Comparative Income Statement from the following information:
| Particulars | 2013 Rs. |
2014 Rs. |
| Manufacturing expenses | 35,000 | 80,000 |
| Opening stock | 30,000 | 60% of closing stock |
| Sales | 9,60,000 | 4,50,000 |
| Returns outward | 4,000 (out of credit purchase) | 6,000 (out of cash purchase) |
| Closing stock | 150% of opening stock | 1,00,000 |
| Credit purchases | 1,50,000 | 150% of cash purchase |
| Cash purchases | 80% of credit purchases | 40,000 |
| Carriage outward | 10,000 | 30,000 |
| Building | 1,00,000 | 2,00,000 |
| Depreciation on building | 20% | 10% |
| Interest on bank overdraft | 5,000 | – |
| 10% debentures | 2,00,000 | 20,00,000* |
| Profit on sale of copyright | 10,000 | 20,000 |
| Loss on sale of personal car | 10,000 | 20,000 |
| Other operating expenses | 20,000 | 10,000 |
| Tax rate | 50% | 40% |
*There is a misprint in the book, this should be 2,00,000
Answer:
|
Comparative Income Statement for the years ended March 31, 2013 and 2014 |
|||||
|
Particulars |
Note No. |
2013 (Rs) |
2014 (Rs) |
Absolute Change |
Percentage Change |
|
1. Revenue from Operations |
9,60,000 |
4,50,000 |
(5,10,000) |
(53.13) |
|
|
2. Other Income |
10,000 |
20,000 |
10,000 |
100 |
|
|
3. Total Revenue (1 + 2) |
9,70,000 |
4,70,000 |
(5,00,000) |
(51.55) |
|
|
4. Expenses |
|||||
|
a. Purchases of Stock-in-Trade |
2,66,000 |
94,000 |
(1,72,000) |
(64.7) |
|
|
b. Change in Inventories |
(15,000) |
(40,000) |
(55,000) |
(366.7) |
|
|
c. Finance Costs |
25,000 |
20,000 |
(5,000) |
(20) |
|
|
d. Depreciation and Amortisation Expenses |
20,000 |
20,000 |
– | – | |
|
e. Other Expenses |
30,000 |
40,000 |
10,000 |
33.33 |
|
|
Total Expenses |
3,26,000 |
1,34,000 |
(1,92,000) |
58.90 |
|
|
5. Profit before Tax (3 – 4) |
6,44,000 |
3,36,000 |
(3,08,000) |
47.83 |
|
|
Less: Income Tax |
3,22,000 |
1,34,400 |
(1,87,600) |
58.26 |
|
|
6. Profit After Tax |
3,22,000 |
2,01,600 |
1,20,400 |
37.39 |
|
Working Notes
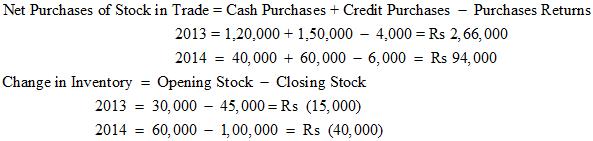
1. Calculation of Net Purchases and Change in Inventory
2. Calculation of Finance Cost
Finance Cost = Interest on Bank Overdraft + Interest on Debentures
Finance Cost (2013) = 5,000 + 20,000 = Rs 25,000
Finance Cost (2014) = 0 + 20,000 = Rs 20,000
3. Calculation of Other Expenses
Other Expenses = Carriage outward + Other operating expenses
Other Expenses (2013) = 10,000 + 20,000 = Rs 30,000
Other Expenses (2014) = 30,000 + 10,000 = Rs 40,000
Q16: Prepare a Common-size income statement of Shefali Ltd. with the help of following information
| Particulars | 2013 Rs. |
2014 Rs. |
| Sales | 6,00,000 | 8,00,000 |
| Gross profit | 50% of sales | 45% of sales |
| Indirect expense | 25% of gross profit | 25% of gross profit |
| Less: Cost of goods sold | 4,28,000 | 7,28,000 |
| Other incomes | 10,000 | 12,000 |
| Income tax | 30% | 30% |
Answer:
|
Common Size Income Statement for the years ended March 31, 2013 and 2014 |
|||||
|
Particulars |
Note No. |
2013 (Rs) |
2014 (Rs) |
Percentage of Sales |
|
|
2013 |
2014 |
||||
|
1. Revenue from Operations |
6,00,000 |
8,00,000 |
100 |
100 |
|
|
2. Other Income |
10,000 |
12,000 |
1.67 |
1.5 |
|
|
3. Total Revenue (1 + 2) |
6,10,000 |
8,12,000 |
101.67 |
101.5 |
|
|
4. Expenses |
|||||
|
a. Cost of Goods Sold |
4,28,000 |
7,28,000 |
71.33 |
91 |
|
|
b. Other Expenses |
75,000 |
90,000 |
12.50 |
11.25 |
|
|
Total Expenses |
5,03,000 |
8,18,000 |
83.83 |
102.25 |
|
|
5. Profit before Tax (3 – 4) |
1,07,000 |
(6,000) |
17.83 |
(0.75) |
|
|
Less: Income Tax |
32,100 |
– |
5.35 |
– |
|
|
6. Profit After Tax |
74,900 |
(6,000) |
12.48 |
(0.75) |
|
Working Notes
1Calculation of Other Expenses
Other Expenses = Indirect Expenses = % of Gross Profit
![]()
Q17: Prepare a Common Size balance sheet from the following balance sheet of Aditya Ltd. and Anjali Ltd.:
| Particulars | Aditya Ltd. Rs. |
Anjali Ltd. Rs. |
| I. Equity and Liabilities | ||
|
a) Equity share capital
|
6,00,000 | 8,00,000 |
|
b) Reserves and surplus
|
3,00,000 | 2,50,000 |
|
c) Current liabilities
|
1,00,000 | 1,50,000 |
| Total | 10,00,000 | 12,00,000 |
| II. Assets | ||
|
a) Fixed assets
|
4,00,000 | 7,00,000 |
|
b) Current assets
|
6,00,000 | 5,00,000 |
| Total | 1,00,0000* | 12,00,000 |
*The total of Liabilities side must be equal to the total of Assets side, therefore, it should be 10,00,000.
Answer:
|
Common Size Balance Sheet |
||||
|
Particulars |
Aditya Ltd. (Rs) |
Anjali Ltd. (Rs) |
% of Total |
|
|
Aditya Ltd. |
Anjali Ltd. |
|||
|
I. Equity and Liabilities |
||||
|
1. Shareholder’s Fund |
||||
|
a. Equity Share Capital |
6,00,000 |
8,00,000 |
60 |
66.67 |
|
b. Reserves and Surplus |
3,00,000 |
2,50,000 |
30 |
20.83 |
|
2. Current Liabilities |
1,00,000 |
1,50,000 |
10 |
12.5 |
|
Total |
10,00,000 |
12,00,000 |
100 |
100 |
|
II. Assets |
||||
|
1. Non-Current Assets |
||||
|
a. Fixed Assets |
4,00,000 |
7,00,000 |
40 |
58.33 |
|
2. Current Assets |
6,00,000 |
5,00,000 |
60 |
41.67 |
|
Total |
10,00,000 |
12,00,000 |
100 |
100 |