Exercise 1
Question 1: Total no. of animals in five villages are as follows:
Village V = 120
Village W = 60
Village X = 80
Village Y = 50
Village Z = 90
Prepare a table of the animals with the help of a symbol 1 in ques which represent 20 animals.
![]()
Answer the given questions:
a) How many symbols represent animals of village X?
b) Name the village which has min no. of animals?
c) Name the village which has max no. of animals?
d) Arrange the name of villages in ascending order according to the number of animals.
Answer
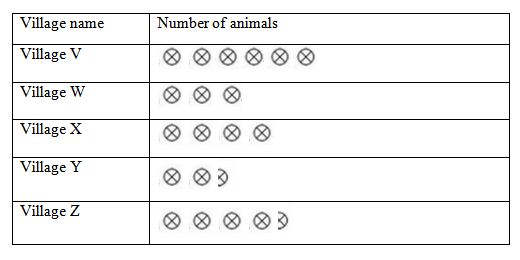
a) For village X, four symbols are used to represent 80 animals.
b) The min no. of animals are present in village Y.
c) The max no. of animals are present in village V.
d) The ascending order of villages according to the number of animals is as given below
Village Y < Village W < Village X < Village Z < Village V
Question 2:
| Year | Number of Students |
| 2001 | 500 |
| 2002 | 465 |
| 2003 | 324 |
| 2004 | 264 |
| 2005 | 753 |
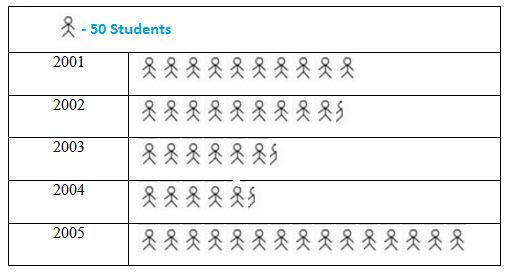
The table given below represents the total no. of students in different years.
Make a table which represents the number of students present in each year using a symbol that is equal to 100 students.
a) Number of students present in year 2003 is represented using how many symbols?
b) In which year max no of students are there?
Make a table which represents the number of students present in each year using another symbol that is equal to 50 students.
Answer:

a) The number of symbols used to represent student of year 2003 is three and a half.
b) In year 2005, max numbers of students are there.
Exercise 2
Question 1 :
The graph given below shows the quantity of rice purchased by govt. from year 2001 to 2005.

1 unit length = 10 thousand tones
Observe the graph and answer the following questions
a) Maximum rice production
b) Minimum rice production
c) Production of rice in year 2003
Answer
a) Maximum production of rice is there in year 2004.
b) Minimum production of rice is there in year 2001
Question 2
The graph given below shows the sale of tee-shirts from Mon to Sat.
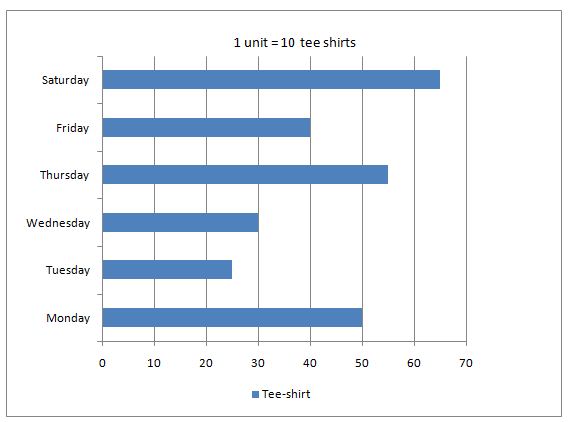
Answer the following questions from the bar graph:
a) The bar graph gives information about what.
b) The scale selected to represent the number of tee shirts is.
c) The max no. of t-shirts were sold on which day? How many tee shirts?
d) Give the number of tee shirts sold on Wednesday?
Answer
a) The bar graph gives information of tee-shirts sold from Mon to Sat.
b) The scale selected to represent the number of tee-shirts is 1 unit = 10 tee-shirts
c) Max numbers of tee-shirts were sold on Saturday. That is 65.
d) The numbers of tee – shirts sold on Wednesday were 30.
Question 3
The graph given below shows the marks of Ashish in mid-term exam in 5 subjects.
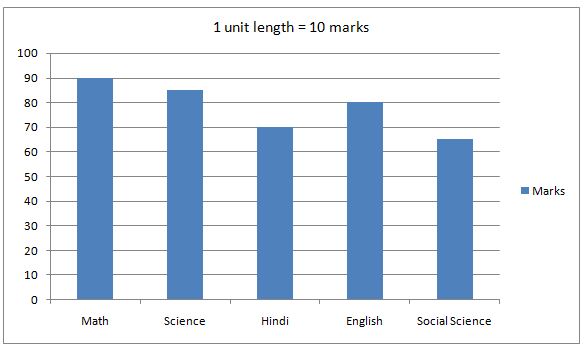
Answer the following questions from the bar graph:
a) The bar graph gives information about what?
b) Give the name of sub. in which Ashish scored max marks.
c) Give the name of sub. in which Ashish scored min marks.
d) Give name of the subjects with the marks.
Answer
a) The bar graph gives information about the marks scored by Ashish in each subject.
b) Ashish scored max marks in Math. That is 90.
c) Ashish scored min marks in Social Science. That is 65.
d) Maths – 90
Science – 85
Hindi – 70
English – 80
Social Science – 65
Exercise 3
Question 1
A survey was done to find in which game students are interested in their free time. Total numbers of students were 150.
| Name of game | Number of students |
| Basketball | 40 |
| Cricket | 55 |
| Football | 25 |
| Hockey | 10 |
| Athletics | 20 |
Draw a graph to show the given information. Take a scale- 1 unit length = 5 students.
a) Which game is preferred maximum by the students?
b) Which game is preferred maximum after basketball?
Answer
The bar graph of the above information is as given below.
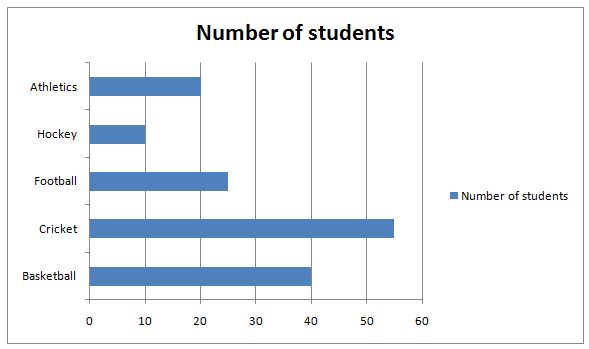
a) Cricket is the game which is preferred maximum by the students.
b) Football is the game preferred by students after basketball.
Question 2
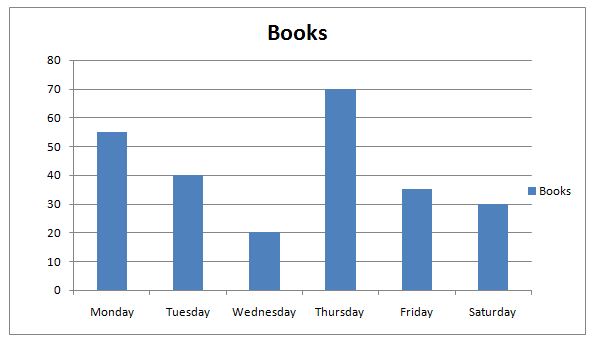
The given table shows the number of Science books sold on 6 consecutive days.
| Days | Number of books sold |
| Monday | 55 |
| Tuesday | 40 |
| Wednesday | 20 |
| Thursday | 70 |
| Friday | 35 |
| Saturday | 30 |
To represent the above information, draw a graph by choosing a scale according to you.
Answer
Take a scale of 1 unit length = 10 books
The bar graph is as given below.
Question 3
Given table shows manufacture of cars in a factory from 2000 to 2004.
Represent the data with the help of bar graph.
| Year | Number of cars manufactured |
| 2000 | 700 |
| 2001 | 500 |
| 2002 | 900 |
| 2003 | 1300 |
| 2004 | 1500 |
a) In year 2003, how many cars were manufactured?
b) The max numbers of cars are manufactured in the year ____.
c) The min numbers of cars are manufactured in the year ____.
Answer
The bar graph given below shows the information.
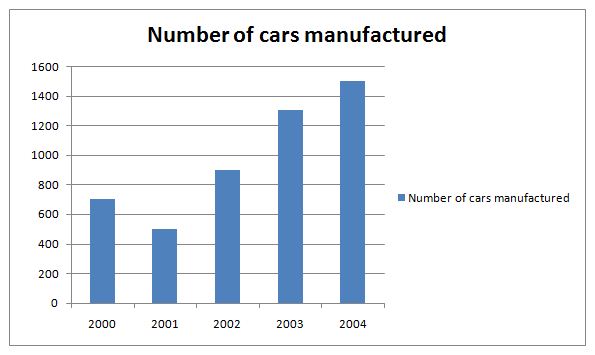
a) In 2003, 1300 cars were manufactured.
b) The max numbers of cars are manufactured in the year 2004. That is 1500.
c) The min numbers of cars are manufactured in the year 2001. That is 500.
Question 4
Number of people in different age groups in a city is given below.
| Age group | 1 – 14 | 15 – 29 | 30 – 44 | 45 – 59 | 60 – 74 | 75 and above |
| Number of people | 3 lakh | 3 lakh 20 thousand | 2 lakh 40 thousand | 2 lakh 20 thousand | 1 lakh 60 thousand | 80 thousand |
Answer
Take a scale of 1 unit length = 20 thousand.
Bar graph of the given information is as below.
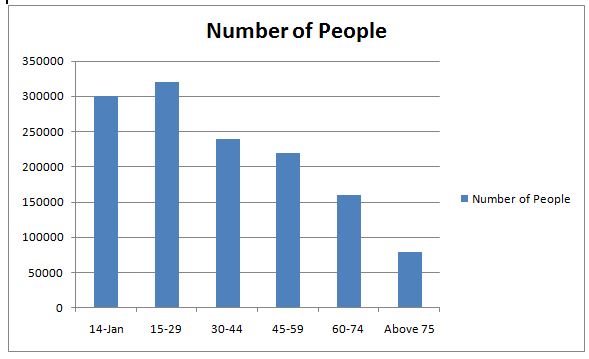
a) The total number of people from age group 15 to 44 is 5 lakh 60 thousand.
Total = (age 15 – 29) + (age 30 – 44)
= 320000 + 240000
= 560000
b) There are 2 lakh 40 thousand senior citizens in the city.
Total = 160000 + 80000
= 240000