Exercise : Solutions of Questions on Page Number : 59
Q1 :What is marginal propensity to consume? How is it related to marginal propensity to save?
Answer : Marginal propensity to consume refers to the ratio of change in the consumer’s expenditure due to the change in disposable income (income after deducting taxes). In other words, MPC measures how consumption will vary with the change in income.
So,
MPC ![]()
Where,
ΔC = Change in consumption
ΔY = Change in income
For example, if income increases from Rs 200 crores to Rs 250 crores and consumption increases from Rs 20 crores to Rs 40 crores, it implies that 0.4 is the MPC or 40% increase in the income is being consumed.
This can further be explained with the help of a table and a diagram.
If income and consumption are:
| Income in Rs (Y) | Consumption Expenditure in Rs (C) |
| 200 | 20 |
| 250 | 40 |
Then MPC![]()
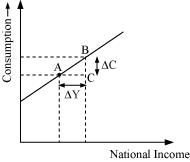
Also, MPC can be explained with the given diagram.
In the diagram, x-axis represents national income and y-axis represents consumption level.
So, MPC ![]()
The relationship between MPC and MPS can be explained as –
Y = C + S (Assuming that the income earned is either consumed or saved)
Or, ΔY = ΔC + ΔS
Dividing both sides by ΔY
![]()
Or, 1 = MPC + MPS
Or, MPC = 1 – MPS
Or, MPS = 1 – MPC
So, the sum of MPC and MPS is always equal to unity.
Q2 : What is the difference between ex ante investment and ex post investment?
Answer :
| S.No. | Ex-ante Investment | Ex-post Investment |
| 1. | It refers to the planned or intended investment during a particular period of time. | It refers to the actual level of investment during a particular period of time. |
| 2. | It is imaginary (intended), in which a firm assumes the level of investment on its own. | It is factual or original that signifies the existing investment of a particular time. |
| 3. | It is planned on the basis of future expectations. | It is the actual result of variables. |
Q3 :What do you understand by ‘parametric shift of a line’? How does a line shift when its (i) slope decreases, and (ii) its intercept increases?
Answer :
Considering the equation of a straight line as
b = ma + ε
Where m = slope of straight line, m > 0
ε = intercept on vertical axis, ε > 0
Also, when a increases by 1 unit, the value of b increases by m units.
The parameters ε and m are parameters of a graph.
As the value of m increases, the straight line rotates upward around the same vertical intercept. This movement is an example of parametric shift of the graph.
(i) A straight line rotates downward around the same vertical intercept as its slope decreases.
(ii) A straight line shifts parallelly upward when its intercept increases.
Q4 :What is ‘effective demand’? How will you derive the autonomous expenditure multiplier when price of final goods and the rate of interest are given?
Answer : Effective demand refers to a situation in which equilibrium output is determined solely by the level of aggregate demand. This is because of the assumption that the supply is infinitely elastic and if there exists any inequality between the Aggregate Demand (AD) and the Aggregate Supply (AS), then the equilibrium output will only be influenced by AD. The concept of effective demand can be explained with the help of the given diagram.
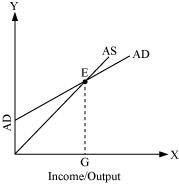
The x-axis represents income/output level and y-axis represents the level of aggregate demand. E is the equilibrium point where the two curves AS and AD meet. EG is the effective demand and output level is determined by AD (assuming the elasticity of supply to be perfectly elastic).
Autonomous expenditure multiplier is derived as
Y = AD (at equilibrium)
Y = A + cY [Where AD = A + cY]
Y – cY = A
Y (1 – c) = A
![]()
Where
A = Autonomous expenditure
c = MPC
Y = level of income
![]() = autonomous expenditure multiplier
= autonomous expenditure multiplier
So, the autonomous expenditure multiplier is dependent on the income and MPC.
Q5 : Measure the level of ex-ante aggregate demand when autonomous investment and consumption expenditure (A) is Rs 50 crores, and MPS is 0.2 and level of income (Y) is Rs 4000 crores. State whether the economy is in equilibrium or not (cite reasons).
Answer :
Consumption expenditure (A) = Rs 50 Crores
MPS = 0.2
So, MPC = 1 – MPS
= 1 – 0.2
= 0.8
Y = 4000 Crores
We know that AD = A + cY (1)
Putting the values in equation (1)
AD = 50 + 0.8 x 4000
= 50 + 3200
= Rs 3250 Crores
But, Rs 3250 < Rs 4000
Implies that AD < Y
Hence, the economy is not in equilibrium
Q6 :Explain ‘Paradox of Thrift’.
Answer : Paradox of thrift refers to a situation in which people tend to save more money, thereby leading to a fall in the savings of the economy as a whole. In other words, when everyone increases his/her saving-income proportion i.e. MPS (s), then, the aggregate demand will fall as consumption decreases. This will further lead to a decrease in employment and income level and finally this will reduce the total savings for the economy. This concept was suggested by Keynes wherein increased saving at individual levels will gradually lead to the slowdown of economy in terms of circular flow of income.