
Exercise 15.1 : Solutions of Questions on Page Number : 283
Q1 : In a cricket math, a batswoman hits a boundary 6 times out of 30 balls she plays. Find the probability that she did not hit a boundary.
Answer :
Number of times the batswoman hits a boundary = 6
Total number of balls played = 30
∴ Number of times that the batswoman does not hit a boundary = 30 – 6 = 24

Q2 : 1500 families with 2 children were selected randomly, and the following data were recorded:
| Number of girls in a family |
2 |
1 |
0 |
| Number of families |
475 |
814 |
211 |
Compute the probability of a family, chosen at random, having
(i) 2 girls (ii) 1 girl (iii) No girl
Also check whether the sum of these probabilities is 1.
Answer :
Total number of families = 475 + 814 + 211
= 1500
(i) Number of families having 2 girls = 475

(ii) Number of families having 1 girl = 814

(iii) Number of families having no girl = 211|

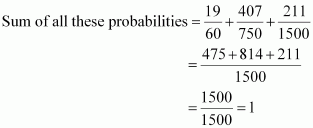
Therefore, the sum of all these probabilities is 1.
Q3 : In a particular section of Class IX, 40 students were asked about the months of their birth and the following graph was prepared for the data so obtained:
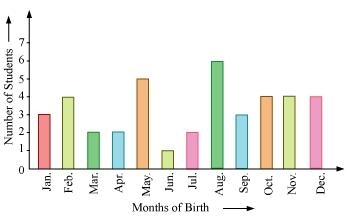
Find the probability that a student of the class was born in August.
Answer :
Number of students born in the month of August = 6
Total number of students = 40


Q4 : Three coins are tossed simultaneously 200 times with the following frequencies of different outcomes:
|
Outcome |
3 heads |
2 heads |
1 head |
No head |
|
Frequency |
23 |
72 |
77 |
28 |
If the three coins are simultaneously tossed again, compute the probability of 2 heads coming up.
Answer :
Number of times 2 heads come up = 72
Total number of times the coins were tossed = 200

Q5 : An organization selected 2400 families at random and surveyed them to determine a relationship between income level and the number of vehicles in a family. The information gathered is listed in the table below:
| Monthly income (in Rs) | Vehicles per family | |||
| 0 | 1 | 2 | Above 2 | |
| Less than 7000 | 10 | 160 | 25 | 0 |
| 7000 – 10000 | 0 | 305 | 27 | 2 |
| 10000 – 13000 | 1 | 535 | 29 | 1 |
| 13000 – 16000 | 2 | 469 | 59 | 25 |
| 16000 or More | 1 | 579 | 82 | 88 |
Suppose a Family is chosen , find the probability that th family chosen is
(i) earning Rs 10000-13000 per month and owning exactly 2 vehicles.
(ii) earning Rs 16000 or more per month and owning exactly 1 vehicle.
(iii) earning less then Rs 7000 per month and does not own any vehicle.
(iv) earning Rs 13000-16000 per month and owning more then 2 vehicles.
(v) owning not more then 1 vehicle.
Answer :
Number of total families surveyed = 10 + 160 + 25 + 0 + 0 + 305 + 27 + 2 + 1 + 535 + 29 + 1 + 2 + 469 + 59 + 25 + 1 + 579 + 82 + 88 = 2400
(i) Number of families earning Rs 10000 – 13000 per month and owning exactly 2 vehicles = 29
Hence, required probability,
(ii) Number of families earning Rs 16000 or more per month and owning exactly 1 vehicle = 579
Hence, required probability,
(iii) Number of families earning less than Rs 7000 per month and does not own any vehicle = 10
Hence, required probability,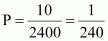
(iv) Number of families earning Rs 13000 – 16000 per month and owning more than 2 vehicles = 25
Hence, required probability,
(v) Number of families owning not more than 1 vehicle = 10 + 160 + 0 + 305 + 1 + 535 + 2 + 469 + 1 + 579 = 2062
Hence, required probability,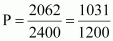
Q6 : A teacher wanted to analyse the performance of two sections of students in a mathematics test of 100 marks. Looking at their performances, she found that a few students got under 20 marks and a few got 70 marks or above. So she decided to group them into intervals of varying sizes as follows: 0 – 20, 20 – 30… 60 – 70, 70 – 100. Then she formed the following table:
| Marks | Number of Student |
| 0 -20 | 7 |
| 20 -30 | 10 |
| 30 – 40 | 10 |
| 40 – 50 | 20 |
| 50 – 60 | 20 |
| 60 – 70 | 15 |
| 70 – above | 8 |
| Total | 90 |
(i) Find the probability that a student obtained less than 20 % in the mathematics test.
(ii) Find the probability that a student obtained marks 60 or above.
Answer :
Totalnumber of students = 90
(i) Number of students getting less than 20 % marks in the test = 7
Hence, required probability,
(ii) Number of students obtaining marks 60 or above = 15 + 8 = 23
Hence, required probability,
Q7 : To know the opinion of the students about the subject statistics, a survey of 200 students was conducted. The data is recorded in the following table.
| Opinion | Number of students |
| like dislike |
135 65 |
Find the probability that a student chosen at random
(i) likes statistics, (ii) does not like it
Answer :
Total number of students = 135 + 65 = 200
(i) Number of students liking statistics = 135

(ii) Number of students who do not like statistics = 65

Q8 : The distance (in km) of 40 engineers from their residence to their place of work were found as follows.
| 5 | 3 | 10 | 20 | 25 | 11 | 13 | 7 | 12 | 31 |
| 19 | 10 | 12 | 17 | 18 | 11 | 32 | 17 | 16 | 2 |
| 7 | 9 | 7 | 8 | 3 | 5 | 12 | 15 | 18 | 3 |
| 12 | 14 | 2 | 9 | 6 | 15 | 15 | 7 | 6 | 12 |
What is the empirical probability that an engineer lives:
(i) less than 7 km from her place of work?
(ii) more than or equal to 7 km from her place of work?
(iii) within km from her place of work?
Answer :
(i) Total number of engineers = 40
Number of engineers living less than 7 km from their place of work = 9
Hence, required probability that an engineer lives less than 7 km from her place of work,
(ii) Number of engineers living more than or equal to 7 km from their place of work = 40 – 9 = 31
Hence, required probability that an engineer lives more than or equal to 7 km from her place of work,
(iii) Number of engineers living within km from her place of work = 0
Hence, required probability that an engineer lives within km from her place of work, P = 0
Q11 : Eleven bags of wheat flour, each marked 5 kg, actually contained the following weights of flour (in kg):
4.97 5.05 5.08 5.03 5.00 5.06 5.08 4.98 5.04 5.07 5.00
Find the probability that any of these bags chosen at random contains more than 5 kg of flour.
Answer :
Number of total bags = 11
Number of bags containing more than 5 kg of flour = 7
Hence, required probability,
Q12 :
| Concentration of SO2 (in ppm) | Number of days (frequency ) |
| 0.00 – 0.04 | 4 |
| 0.04 – 0.08 | 9 |
| 0.08 – 0.12 | 9 |
| 0.12 – 0.16 | 2 |
| 0.16 – 0.20 | 4 |
| 0.20 – 0.24 | 2 |
| Total | 30 |
The above frequency distribution table represents the concentration of sulphur dioxide in the air in parts per million of a certain city for 30 days. Using this table, find the probability of the concentration of sulphur dioxide in the interval 0.12 – 0.16 on any of these days.
Answer :
Number days for which the concentration of sulphur dioxide was in the interval of 0.12 – 0.16 = 2
Total number of days = 30
Hence, required probability,
Q13 :
| Blood group | Number of students |
| A | 9 |
| B | 6 |
| AB | 3 |
| O | 12 |
| Total | 30 |
The above frequency distribution table represents the blood groups of 30 students of a class. Use this table to determine the probability that a student of this class, selected at random, has blood group AB.
Answer :
Number of students having blood group AB = 3
Total number of students = 30
Hence, required probability,